



Measures of Success
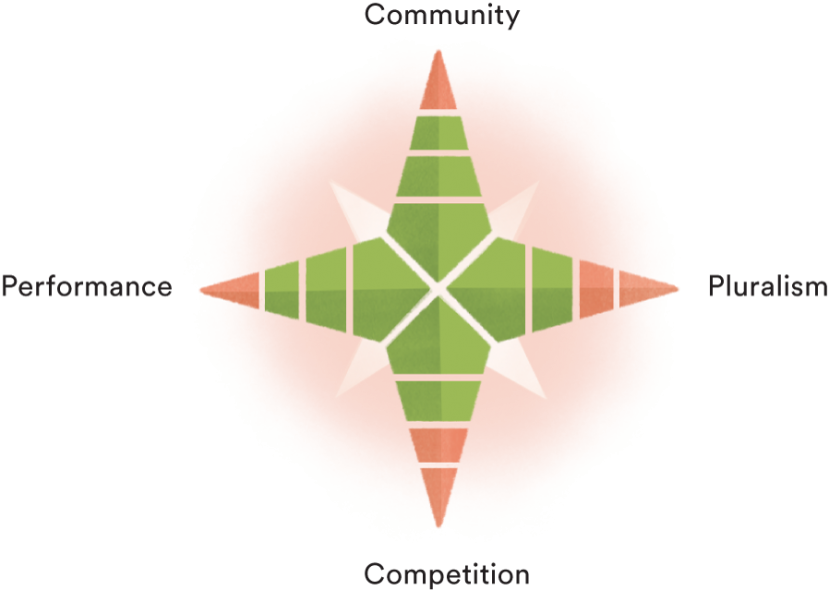
As we work to build a more robust and successful education system in Georgia, we must ground our work in where our state’s education landscape currently stands. Below you will find an in-depth analysis of how Georgia is currently rated across each of 50CAN: The 50-State Campaign for Achievement Now’s four dimensions of a healthy and dynamic learning system.
Introduction to change lenses
Key

Fully Present

Partially Present

Not Present

Not Applicable
There was not enough information to make an assessment.
Highlighted text:
This indicator of success is foundational to 50CAN’s educational advocacy and this indicator’s respective change lens. As such, this indicator carries a higher weight/value when assessing whether or not it is present in a given education landscape.
Change lens #1
Community: Effective, sustainable policy change requires strong relationships, real-time feedback and long-term ownership by the people served.
(3 point out of 4) – Our nonprofit and community leaders are engaged in bettering learning outcomes, but we must keep them more regularly, thoroughly informed. Student diversity is our greatest asset—yet our teaching force lacks rich diversity, and we could do more to correct this problem.
Builds strong relationships with people served
Community Engagement and Relationships
Local philanthropic organizations are investing in hyper-localized community efforts and campaigns.
Draws upon a deep understanding of the local context
Teachers and Leadership
Over the past five years, the population of teachers who are people of color has grown by at least 14 percent.
-OR-
Over the past five years, the population of teachers who are people of color has grown by at least three percentage points.
The state has reported having enough teachers for English Language Learners (ELL) at least four times over the last six reporting years.
Feedback and Communication Channels
The state, its districts and its schools show evidence of communicating with, and providing timely feedback to, community members and parents using multiple, public mediums.
For states that have reported not having enough teachers for ELL students (see above indicator), communication with community members and parents is available in other appropriate languages.
*States that have reported having enough ELL teachers have fully achieved this indicator.
The state, its districts and its schools show evidence of communicating with, and providing timely feedback to, community members and parents using multiple, public mediums.
Gives the community ownership of decisions
Community Participation
Community members and parents are sharing stories and voicing concerns about the state’s education system and the schools in their communities.
K-12 Governance Structures
State Board of Education meetings are held at least once a month in an accessible location.
-AND-
State Board of Education meetings provide at least one remote option.
State Board of Education meetings provide the opportunity for public comment on current and non-agenda related items.
The State Board of Education has at least one non-voting community member representative.
State Board of Education membership is reflective of the state’s geographical, racial and socioeconomic make-up.
The chief state school officer (i.e., state superintendent, commissioner of education) is elected, rather than appointed.
Change lens #2
Competition: Greater responsiveness and better outcomes are more likely when people have the power to choose among multiple options to meet their needs.
(2 point out of 4) – We offer students and families a range of education options, but most students are still enrolled in traditional public schools. We could do far more to ensure that parents and children know their options, can readily access them and can easily learn about their quality.
Allows multiple providers to vie for users
Alternatives to Traditional Public Schools
Full (current indicator status): Students and families have access to traditional public schools, public charter schools and at least two other education options.
Partial: In addition to traditional public schools, students and families have access to two other education options.
None: Students and families have limited access to alternative education options outside of traditional public schools (one or no alternative options).
Distribution of Student Enrollment by Sectors
Partial: One education option enrolls between 56 percent and 75 percent of the student population.
None (current indicator status): One education option enrolls more than 76 percent of the student population.
Provides high-quality information to users
Accessible Choice Information
Information is provided by state education agencies, school districts and parent report cards.
State and local education resources provide a step-by-step choice process that includes relevant information and definitions that allow parents to weigh important information easily.
Information to support school choice by parents is complete and includes performance data from the previous three years.
Full: School choice information is available in at least three of the following forms: online, print, in-person meetings and/or fairs to ensure that the largest group of people are able to access it.
Partial: School choice information is available in at least two of the following forms: online, print, in-person meetings and/or fairs to ensure that the largest group of people are able to access it.
None (current indicator status): School choice information is available in at least one or none of the following forms: online, print, in-person meetings and/or fairs to ensure that the largest group of people are able to access it.
All families, particularly those that need additional help navigating the choice system, are familiar with and given access to the necessary outlets to ask questions and connect.
Gives providers incentives for improvement and success
Transportation
Full: Students are provided free transportation to any public school of their choice within district borders without any additional burden (i.e., cost, time) to the student or family.
Partial (current indicator status): Students are provided a transportation subsidy to any public school of their choice but parents still bear substantial costs and/or inconvenience.
None: Students are provided a transportation subsidy to traditional public schools of their choice (excluding public charter schools).
Common Enrollment Systems
Full: Within large urban areas, there is a common enrollment application for all public schools within a district’s boundaries.
Partial (current indicator status): Within a district, students and families are not limited to schools based on their geographic location.
None: Rather than sharing a common enrollment application, each school has its own application.
District-Charter Compacts and Collaboration
The state has at least one formal agreement between districts and public charter schools that aims to provide equal access to high-quality schools for all students.
Equitable Funding Formulas
Full: The state has a funding formula that allows dollars to follow students to the school of their choice. The funding formula is weighted based on student need (i.e., special education, English Language Learner, etc.)
Partial: At least 75 percent of a district’s operating budget is allocated using the weighted student funding formula (as described above).
None (current indicator status): At least 50 percent of a district’s operating budget is allocated using the weighted student funding formula (as described above).
Change lens #3
Performance: Success requires both the flexibility to pursue excellence and rigorous standards to ensure those serving the public are held accountable for their results.
(3 points out of 4) – With rigorous standards, aligned assessments and easy-to-understand state report cards, performance is one of our strengths. Yet there is plenty of room for improvement, from increasing supports for educators to ensuring pay and job protection are related to educator quality.
Empowers strong leaders to make decisions
School Leader Flexibility
School leaders set their own priorities on spending for staff, technology, facilities and/or other purposes.
Programs to develop school leaders include individual supports such as professional learning, evaluations or both.
Sets rigorous standards for success
Standards and Statewide Assessments
-AND-
State learning standards are presented in clear, single documents that allow teachers to look at their own grade-level expectations with ease.
-AND-
Assessment results are easily accessed and understood by parents and community stakeholders.
Holds parties accountable for results
Accountability Systems and Mechanisms
-AND-
Assessments of school performance include analyzing school environment (i.e., review of attendance, re-enrollment, school culture, etc.).
Teacher Quality and Accountability
-AND-
Teacher evaluations include analyzing classroom environment (i.e., survey data, classroom observations, etc.).
Change lens #4
Pluralism: Diverse populations are better served by dynamic systems that support lots of paths to success and embrace different traditions, values and beliefs.
(2 points out of 4) – We have made progress in developing a diversity of educational programs. However, we must ensure that the types and numbers of schools and educational approaches are not limited. We should also strive to develop a more well-rounded definition of student success.
Allows for multiple, unique pathways to success
Differences in Educational Approach and Learning
Encourages all groups to join
Providers of Educational Approaches and Learning
Embraces diversity and differences
Defining Educational Success
Inclusivity
-AND-
Districts and their schools provide staff trainings on bullying prevention.
-AND/OR-
Districts and their schools offer counseling on the impact of immigration status on students and their family members.
-AND/OR-
Districts and their schools provide “know your rights” presentations.